
Sales reporting process guide for hospitality venues

The sales reporting process is a structured system that collects, validates, and presents sales data so hospitality managers can make informed decisions on staffing, purchasing, and pricing without waiting for month-end surprises. For venue owners running cafés, bars, restaurants, or fast-casual operations, this process is the difference between reacting to problems and preventing them. Most venues already generate the raw data through their point of sale systems. The gap is almost always in how that data gets organised, reviewed, and acted upon. This guide covers the components, steps, common pitfalls, and decision-making frameworks that make a sales reporting process genuinely useful.
What are the essential components of an effective sales reporting process?
A sales reporting process in hospitality draws from four core data inputs: POS sales data, labour hours, inventory usage, and vendor invoices. Each source answers a different question. POS data tells you what sold and when. Labour hours tell you what it cost to serve those sales. Inventory usage reveals shrinkage, waste, and purchasing efficiency. Vendor invoices confirm whether your cost of goods aligns with what was actually received and used.
The tools that connect these inputs matter considerably. POS-integrated accounting software removes the manual step of re-entering sales figures into a spreadsheet. Cloud-based back-office platforms, such as those built into modern hospitality POS solutions, allow managers to view consolidated data from any device without waiting for a report to be emailed. For venues that want to understand sales reporting automation in practice, the principle is straightforward: the fewer manual handoffs between data sources, the fewer errors.
KPI standardisation is where most venues quietly fail. If your front-of-house manager defines “covers” differently from your bookkeeper, your average spend per cover figure becomes meaningless. Agree on definitions before you build any dashboard. The most useful KPIs for hospitality venues include net sales by category, prime cost (food plus labour as a percentage of revenue), average transaction value, and table or seat turnover rate.
Pro Tip: Build a one-page KPI glossary and share it with every team member who touches reporting. Consistent definitions are worth more than any dashboard feature.
The concept of a weekly flash report is one of the most practical tools in hospitality reporting. Flash reports track controllable costs including food, beverage, and labour, and are designed to be read in five minutes and acted on immediately. They give operators a period-to-date view against plan and against the same period last year, so variances surface early rather than at month-end.
| Data input | What it reveals |
|---|---|
| POS sales data | Revenue by category, time of day, and server |
| Labour hours | Cost of service relative to sales volume |
| Inventory usage | Waste, shrinkage, and purchasing efficiency |
| Vendor invoices | Actual cost of goods versus theoretical cost |
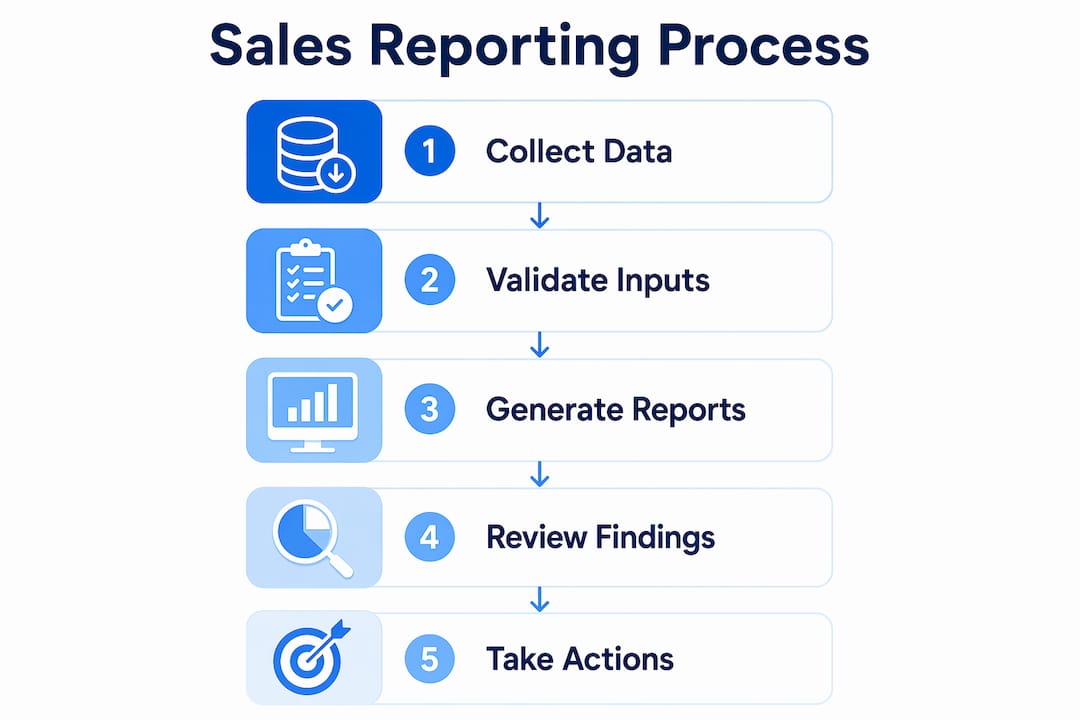
How to build and implement a sales reporting process step by step
A clear sequence prevents the most common mistake in hospitality reporting, which is building a report before deciding what decision it needs to support.
- Define your reporting goals. Start with the decisions you make weekly and monthly. Staffing rotas, purchasing orders, and promotional pricing all require different data. Map each decision to the metric that informs it.
- Select your KPIs. Limit executive dashboards to 10 to 15 KPIs focused on outcome, yield, risk, and growth. More than that and the report becomes noise rather than signal.
- Set data collection and validation routines. Daily reconciliation between your POS totals and bank deposits catches discrepancies before they compound. Automated validation at the point of data ingestion prevents missing fields and invalid entries from corrupting your weekly figures.
- Automate where possible. Configure your POS or back-office system to generate flash reports automatically at the end of each trading day or week. Systems like Oracle Opera, for example, can schedule configurable reports showing projected occupancy and revenue across the next 7, 31, and 365 days, which supports proactive staffing and pricing decisions.
- Establish a review cadence. Weekly flash reports handle short-term variance management. Monthly closes handle trend analysis, forecasting, and strategic decisions. Both are necessary and neither replaces the other.
- Assign action ownership. Every report review should produce named actions with deadlines. Without this step, dashboards become archived data with no operational impact.
The monthly close deserves particular attention. Management accounts delivered within 5 to 7 working days after month-end remain operationally useful. Accounts that arrive three weeks late describe history rather than inform decisions. Achieving that window requires upstream discipline: daily reconciliations, weekly flash reviews, and clean data entry throughout the period.
Pro Tip: Add a “3 actions this week” field to every flash report template. It forces the review meeting to end with commitments, not just observations.
Optimising how your POS system supports this reporting cycle is worth the setup time. A well-configured POS removes the manual extraction step entirely and feeds your reporting layer with clean, timestamped data.
What common challenges arise in hospitality sales reporting?
The most frequent problems in hospitality sales reporting are predictable, and most stem from the same root cause: data that is collected inconsistently or reviewed without a clear process.
- Data delays and reconciliation gaps. Bank deposits rarely match POS totals exactly on the same day due to card settlement timing. Without a daily reconciliation habit, these gaps accumulate and make month-end close far more time-consuming than it needs to be.
- Vanity metrics and inconsistent KPI definitions. Inconsistent definitions and stale data are cited as primary failure modes in sales reporting. A “covers” figure that includes no-shows in one week and excludes them the next makes trend analysis unreliable.
- Manual data entry errors and system silos. When sales data lives in the POS, labour data lives in a separate scheduling tool, and inventory data lives in a spreadsheet, someone has to manually consolidate them. That person will eventually make an error, and the error will not always be obvious.
- Lack of action ownership. Reports that circulate without a named reviewer and a required decision before the next cycle become decorative. The weekly financial cadence only works when it specifies who reviews the report, what decisions are required, and what changes are documented.
The most dangerous report in hospitality is the one that gets read, nodded at, and filed. A report without a named owner and a required action is just a document.
Addressing these challenges requires upstream discipline rather than better dashboards. Clean data entry, daily reconciliation, and consistent KPI definitions are foundational. No reporting tool compensates for inconsistent inputs.
How to use sales reports to drive decisions and improve performance
Sales reports only create value when they connect directly to operational decisions. The framework that works best in hospitality links each KPI to a specific action threshold.
Prime cost is the clearest example. If food and labour combined exceed 65% of net revenue in a given week, that is a flag requiring an immediate response, whether that means reviewing the next week’s rota, auditing portion sizes, or checking whether a supplier invoice was processed correctly. The report does not make the decision. It surfaces the variance so the manager can.
Leading and lagging indicators serve different purposes in this framework. Lagging indicators like last week’s net sales confirm what happened. Leading indicators like advance bookings, reservation volume, and pre-ordered covers predict what is about to happen. Combining both in a single dashboard gives managers the ability to act before a slow period hits rather than after it has already affected revenue.
Pro Tip: Track average spend per cover alongside total covers. A venue can hit its revenue target with fewer customers spending more, or more customers spending less. The split changes your staffing and purchasing response entirely.
Effective restaurant reservation management feeds directly into this leading indicator layer. Reservation data tells you expected covers 48 to 72 hours out, which is exactly the window you need to adjust staffing levels without incurring overtime costs.
| KPI | Decision it informs |
|---|---|
| Prime cost percentage | Rota adjustments, portion control, supplier review |
| Average spend per cover | Menu engineering, upselling training, promotional pricing |
| Table or seat turnover | Floor layout, service pacing, booking slot duration |
| Period-to-date vs plan | Purchasing volume, promotional activity, staffing levels |
The inventory management dimension of sales reporting is often underused. Connecting sales volume to inventory depletion rates reveals theoretical versus actual usage, which is one of the most reliable indicators of waste or theft in a hospitality operation.
Key takeaways
A sales reporting process only delivers results when it combines clean data, standardised KPIs, a fixed review cadence, and named action ownership at every stage.
| Point | Details |
|---|---|
| Weekly flash reports | Track controllable costs period-to-date and act on variances before month-end. |
| KPI standardisation | Agree on definitions for every metric before building any dashboard or report. |
| Timely management accounts | Deliver monthly accounts within 5 to 7 working days to keep decisions relevant. |
| Action ownership | Every report review must produce named actions with deadlines, not just observations. |
| Upstream data discipline | Daily reconciliation and automated validation prevent errors from compounding. |
What I have learned about building a reporting rhythm that actually sticks
The venues I have seen get this right share one habit: they treat the weekly flash report as a non-negotiable meeting, not an optional read. It takes 20 minutes. It covers the same five numbers every time. And it ends with three written actions before the next session. That consistency is what separates a reporting process from a reporting intention.
The second thing I would tell any venue owner is that the dashboard is the last thing to build, not the first. I have watched managers spend weeks configuring beautiful reporting screens while their underlying data was riddled with inconsistencies. The result was a polished view of unreliable numbers. Fix the data first. Standardise your KPI definitions. Run daily reconciliations. Then build the dashboard on top of a foundation that deserves it.
The third insight is less obvious. Most venues report on what happened. The ones that perform consistently also report on what is about to happen. Advance covers, reservation trends, and pre-booked event revenue are all available before the week starts. Putting those numbers alongside your cost targets at the start of each week changes the conversation from “why did we miss?” to “what do we need to do differently this week?”
Reporting is not an accounting function. It is a management function. The moment a venue owner treats it that way, the numbers start working for them rather than arriving as an unwelcome surprise.
— John
How Ezeepos supports your sales reporting in practice
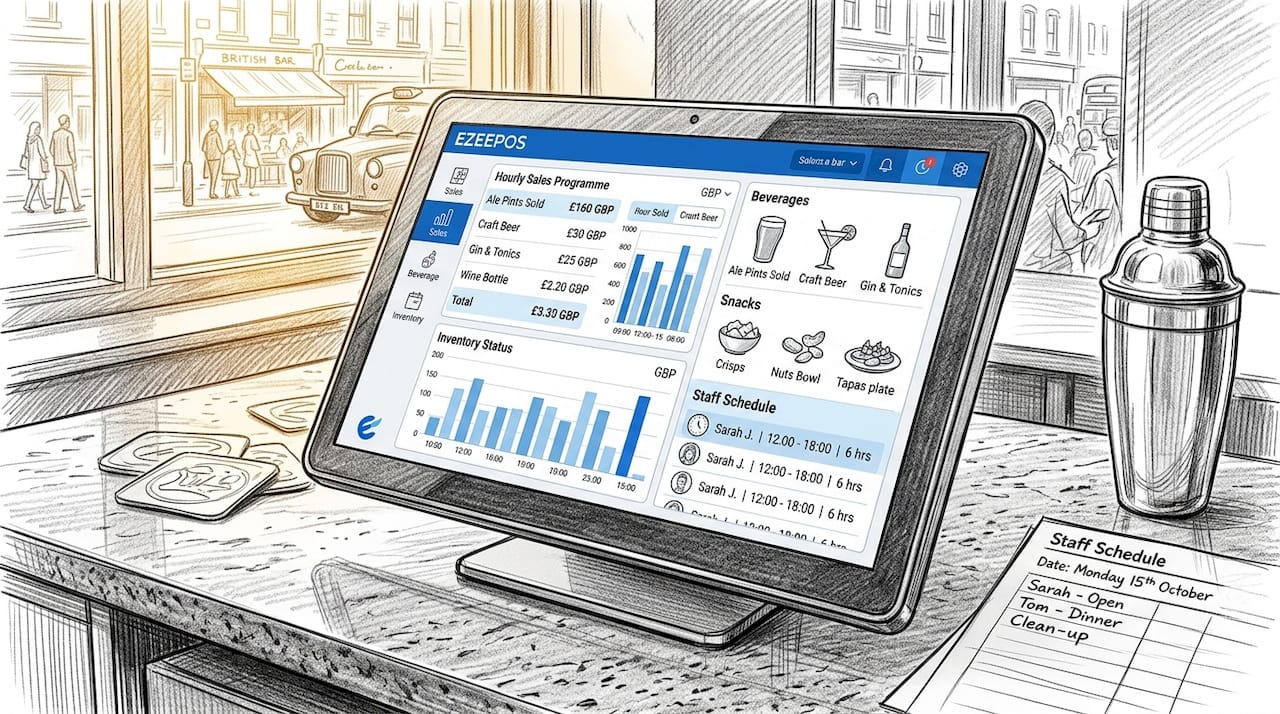
Ezeepos is built for UK hospitality venues that need reliable sales data without the complexity of enterprise software. The platform captures every transaction in real time, feeds a cloud-based back office, and generates the kind of category-level sales summaries that make weekly flash reporting straightforward rather than laborious.
If you are setting up or overhauling your reporting process, the right POS foundation removes the manual extraction step entirely. Ezeepos integrates sales, inventory, and staff data in one place, so your weekly review starts with clean numbers rather than a reconciliation exercise. Explore the Ezeepos POS platform to see how it fits your venue’s reporting needs, or review the benefits of a unified POS for UK hospitality operations.
FAQ
What is a sales reporting process in hospitality?
A sales reporting process is a structured system for collecting, validating, and reviewing sales data to support operational decisions. In hospitality, it typically combines POS data, labour costs, and inventory usage into weekly flash reports and monthly management accounts.
How often should hospitality venues review their sales reports?
Weekly flash reports should be reviewed every seven days to catch variances in food, beverage, and labour costs before they compound. Monthly management accounts should be delivered within 5 to 7 working days after period-end to remain operationally relevant.
What KPIs should appear in a hospitality sales report?
The most useful KPIs include net sales by category, prime cost percentage, average spend per cover, and table turnover rate. Limit your dashboard to 10 to 15 KPIs to keep decision-making fast and focused.
Why do sales reports fail to drive decisions?
Reports fail when they lack a named reviewer, a required action before the next cycle, and documentation of changes made. Without that accountability loop, even accurate reports become archived data with no operational impact.
How does a POS system improve the sales reporting process?
A POS system automates data capture at the point of sale, eliminating manual entry errors and providing timestamped, category-level sales data. Integrated back-office platforms then consolidate that data with labour and inventory figures, making weekly reporting faster and more reliable.
Recent Comments