Restaurant reporting methods 2026: the operator’s guide
Restaurant reporting methods in 2026 are defined by integrated, automated systems that pull POS, inventory, labour, and booking data into a single real-time view. The days of end-of-month spreadsheet marathons are over for any venue serious about margins. This guide covers the five KPIs that matter most, the tools connecting them, and the reconciliation practices that keep you compliant. Whether you run a single café or a multi-site group, the frameworks here apply directly to how you track, interpret, and act on your numbers.
What are the best restaurant reporting methods in 2026?
Effective restaurant reporting in 2026 means centralising data from every operational system into one accessible platform. A POS terminal alone tells you what sold. Add inventory, labour, and booking data and you start to see why margins moved. That shift from transactional records to operational intelligence is the defining characteristic of modern restaurant analytics.
The industry term for this approach is integrated performance reporting. It combines financial KPIs with operational data streams to give managers a complete picture at any moment. The keyword phrase “restaurant reporting methods” captures the same concept but from a search perspective. Both terms are worth knowing because they appear in different contexts across software documentation, accountancy guidance, and HMRC compliance materials.
Three forces are driving adoption in 2026. First, HMRC and tax authorities are cross-referencing 1099-K data from payment processors against filed returns, meaning discrepancies trigger audits faster than before. Second, delivery platforms such as Deliveroo and Uber Eats create fragmented revenue streams that manual processes cannot reconcile accurately. Third, AI-assisted dashboards have dropped in price to the point where independent operators can access the same analytical depth previously reserved for large chains.
Which KPIs should restaurants prioritise, and how often?
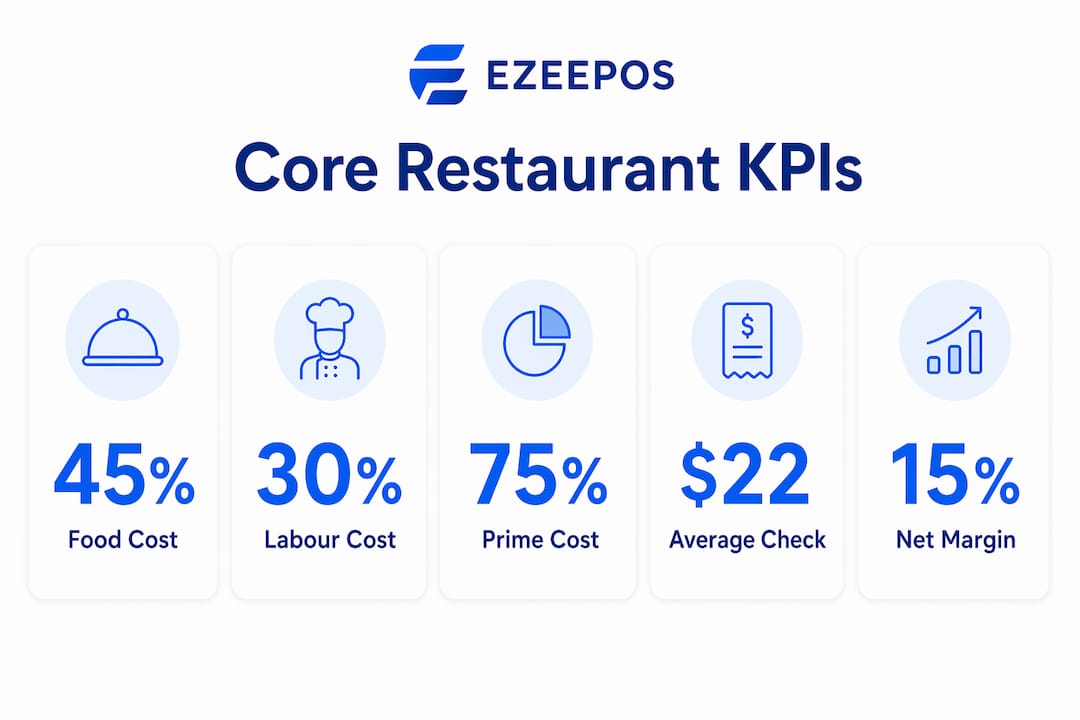
Tracking five core KPIs gives operators a clear snapshot of restaurant health without drowning in data. Those five are food cost percentage, labour cost percentage, prime cost, average check, and net margin. Together they cover the two largest cost centres and the revenue line that connects them.
Daily, weekly, and monthly KPI categories
Not every metric needs daily attention. Grouping by frequency prevents alert fatigue and keeps your team focused.
- Daily: food cost variance, cash over/short, covers served, average check. These shift quickly and require same-day responses.
- Weekly: labour cost percentage, prime cost, delivery platform payouts versus recorded sales. Weekly cycles catch trends before they compound.
- Monthly: net margin, revenue by channel, year-on-year comparisons, and full P&L review. Monthly figures inform strategic decisions such as menu pricing and staffing models.
Prime cost deserves particular attention. It is the sum of food cost and labour cost expressed as a percentage of revenue. A prime cost above 65% in a full-service restaurant signals a structural problem, not a bad week.
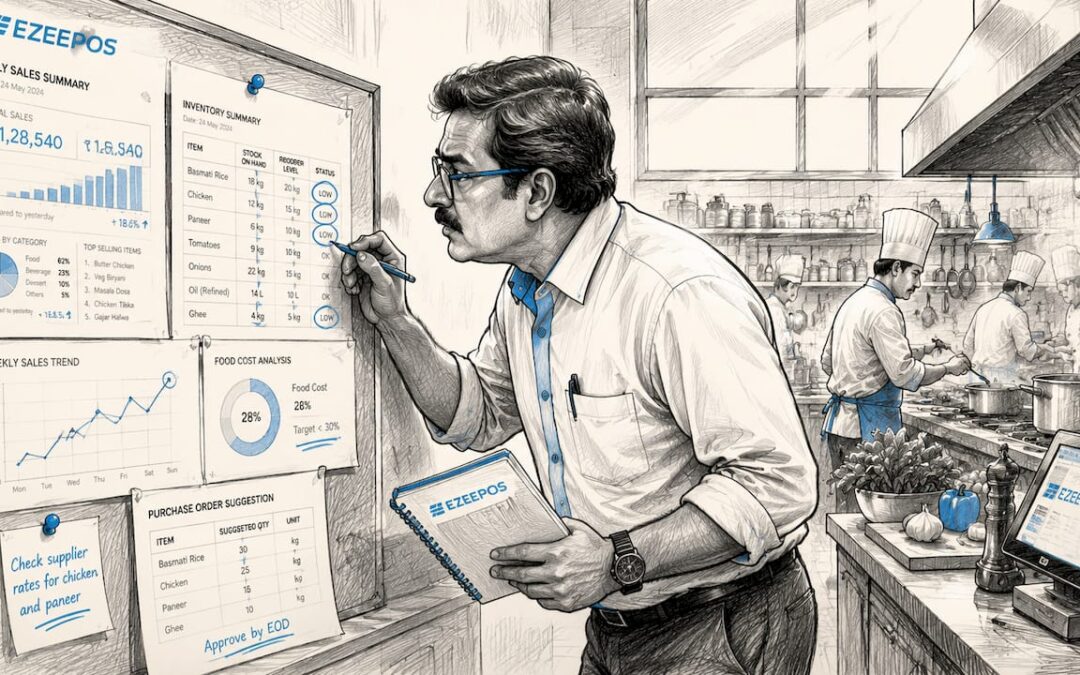
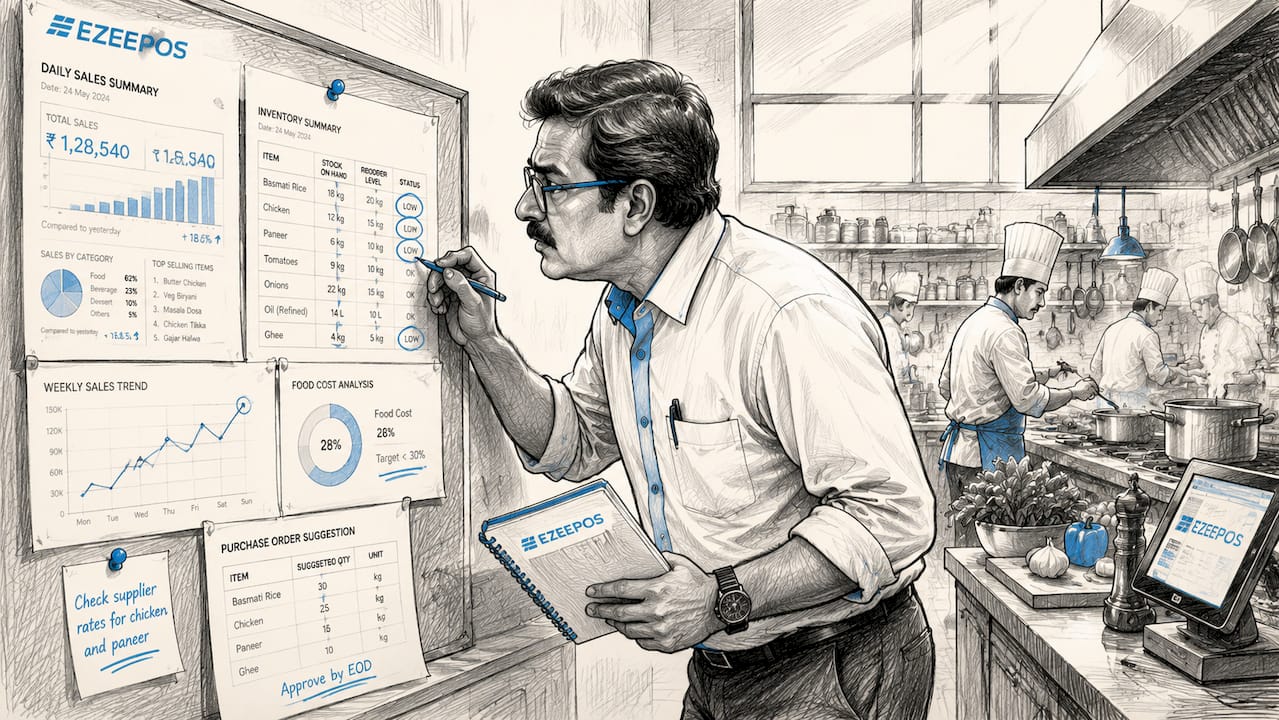
Real-time AI dashboards centralise all KPIs onto a single screen with custom alerts for immediate issue identification. That means a manager on the floor receives a notification when food cost spikes above threshold rather than discovering the problem three weeks later during a monthly review.
Pro Tip: Set your KPI alert thresholds at 5% above your target, not at the target itself. This gives you a warning window before a variance becomes a crisis.
Focusing on a small, consistent set of KPIs shared across the whole team reduces analysis paralysis and enables faster decisions. When every manager reads the same five numbers in the same format, conversations about performance become specific rather than anecdotal.
What tools and integrations enable modern restaurant reporting?
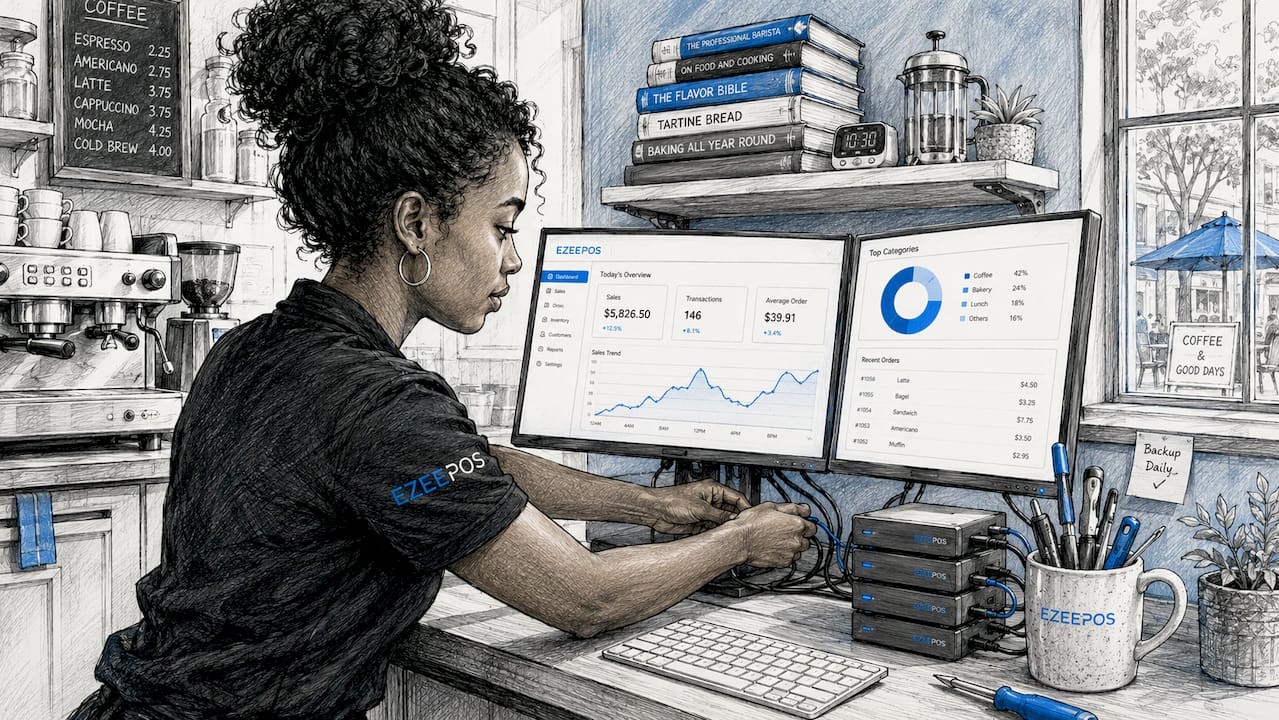
The foundation of any modern reporting setup is a POS system that exports clean, structured data. Most modern POS systems including GloriaFood, Toast, and Lightspeed include basic reporting modules, but enterprise-level needs typically require AI and cloud business intelligence integrations. A standalone POS report shows you yesterday’s sales. A connected BI layer shows you whether yesterday’s sales were profitable.
Comparing reporting tool categories
| Tool category | Core function | Best suited for |
|---|---|---|
| POS built-in reports | Sales totals, item mix, hourly covers | Single-site operators |
| Cloud BI platforms | Normalised multi-source data, trend analysis | Multi-site groups |
| AI analytics tools | Predictive recommendations, anomaly detection | Growth-stage operators |
| Accounting integrations | P&L, cash flow, tax categorisation | Finance and compliance teams |
Implementing a BI reporting layer that automatically normalises data from POS, ERP, and labour systems prevents spreadsheet fatigue and human errors in reporting. For a group with five or more sites, this is not a luxury. It is the only way to produce consistent reports without a dedicated finance analyst at each location.
AI-powered reporting platforms can generate analyses automatically and offer machine learning recommendations for corrective actions. Built-in AI assistants provide fast clarity on performance without manual report digging. A chef who sees that portion sizes on a specific dish are pushing food cost above target does not need to wait for a finance meeting to act.
Accounting software integrations matter too. A detailed chart of accounts that reflects revenue by channel and costs by category improves report accuracy and management relevance. Without it, your P&L lumps delivery revenue with dine-in revenue, making it impossible to calculate the true margin of each channel.
Pro Tip: When evaluating any reporting tool, ask the vendor to demonstrate a live reconciliation between POS sales and your accounting software. If they cannot show it in under five minutes, the integration is not as tight as advertised.
You can explore how POS trends in 2026 are shaping reporting capabilities across UK hospitality venues.
How do you execute accurate sales and tax reconciliation?
Sales and tax reconciliation is the process of confirming that every pound recorded in your POS matches what appears in your bank account, your delivery platform statements, and your tax returns. Tax authorities in 2026 increasingly use 1099-K data from payment processors to verify restaurant sales, and material differences between reported gross receipts and tax returns are the primary trigger for audits.
A structured reconciliation process removes the guesswork. Follow these steps on a daily and weekly basis:
- Reconcile POS totals to payment processor reports daily. Match credit card batches, contactless payments, and cash drawer counts to your POS end-of-day report. Flag any variance above £5 immediately.
- Reconcile delivery platform payouts weekly. Platforms such as Deliveroo and Just Eat remit net amounts after commission. Record gross sales in your POS and commission as a cost of sale. Never record only the net payout as revenue.
- Document your cash rounding policy in writing. Operators frequently overlook cash rounding policies and incomplete tax remittances with third-party delivery platforms, creating tax exposure risks. A one-page internal policy document removes ambiguity during any HMRC review.
- Match vendor invoices to purchase orders weekly. Restaurant accounting requires routine vendor invoice matching alongside inventory counts and sales categorisation to maintain accurate financials.
- Run a monthly three-way reconciliation. Compare your POS sales report, your bank statement, and your accounting software P&L. All three should agree on total revenue within rounding tolerances.
“Waiting until month-end reconciliation makes it impossible to identify when errors or fraud first occurred. Automated daily or weekly reconciliation of delivery app payouts, credit card batches, and cash deposits is vital to catch variances early.”
The reconciliation process also protects against internal fraud. A cashier who voids transactions after payment leaves a pattern in daily cash reconciliation that weekly reviews catch within days rather than months.
What are the common pitfalls in restaurant reporting, and how do you avoid them?
The most common failure in restaurant data tracking is inconsistent data entry at source. If your team categorises a staff meal as a food sale on Monday and as a discount on Tuesday, every report built on that data is unreliable. Consistency at the point of entry is the single biggest driver of report quality.
- Avoid spreadsheet dependency. Multi-unit operators benefit from automated reporting layers rather than manual spreadsheet reports. Automation ensures all managers receive consistent, comparable data without finance team intervention.
- Set up variance alerts, not just reports. A report tells you what happened. An alert tells you when something is wrong right now. Configure your POS or BI platform to flag when food cost exceeds your target by more than 3%.
- Review KPIs at fixed intervals with your team. A weekly 15-minute KPI review with your head chef and front-of-house manager creates accountability. Numbers reviewed in a group get acted on. Numbers emailed to inboxes get ignored.
- Use a sales reporting process guide to standardise your workflow. Documented processes survive staff turnover. Undocumented ones do not.
- Audit your chart of accounts annually. Revenue categories that made sense when you had one revenue stream become misleading once you add delivery, events, and retail. Revisit your account structure every year.
Cloud and AI reporting tools enable restaurants not just to see data but to understand what steps to take next, increasing operational agility. That distinction matters. Data without interpretation is noise. The best reporting setups translate numbers into specific actions before a manager has to ask.
Pro Tip: Assign one person per site as the “reporting owner.” They do not need to be an accountant. They need to run the daily reconciliation, flag variances, and escalate anything unusual. Ownership drives consistency.
Key takeaways
Effective restaurant reporting in 2026 requires integrated systems, five focused KPIs, daily reconciliation, and automated alerts to replace manual processes and reduce compliance risk.
| Point | Details |
|---|---|
| Five core KPIs | Track food cost, labour cost, prime cost, average check, and net margin consistently across your whole team. |
| Daily reconciliation | Match POS totals to payment processor reports every day to catch fraud and errors before they compound. |
| Integrated reporting tools | Connect POS, inventory, labour, and accounting software to eliminate spreadsheet fatigue and manual errors. |
| Tax compliance | Document cash rounding policies and delivery platform tax treatments to reduce audit risk from HMRC. |
| Consistent data entry | Standardise how your team categorises sales and costs at source, as report quality depends entirely on input quality. |
Where restaurant reporting is heading: a view from the floor
The conversation I keep having with operators in 2026 is not about which software to buy. It is about the gap between having data and knowing what to do with it. Most venues now have access to more reporting than they can process. The problem has shifted from data scarcity to data overload.
My honest view is that the operators performing best right now are not the ones with the most sophisticated platforms. They are the ones who picked five KPIs, built a weekly review rhythm, and stuck to it. Automation handles the data collection. Human judgement still handles the interpretation.
The area I watch most closely is predictive analytics. Tools that flag “your Saturday labour cost is trending 8% above last month’s average based on current bookings” are genuinely useful. They shift the conversation from reactive to proactive. That is where the real operational value sits, not in prettier dashboards but in earlier warnings.
The risk I see is operators treating AI recommendations as decisions rather than inputs. A machine learning model does not know that your head chef is on holiday next week or that a local event will double your covers on Thursday. Human context still matters. The best reporting setups combine automated intelligence with experienced interpretation.
— John
How Ezeepos supports your reporting and compliance
Ezeepos is built specifically for UK hospitality venues that need accurate, real-time data without the complexity of enterprise software. The platform connects POS sales reporting with inventory control, staff management, and cloud back-office tools in one system. That means your food cost, labour cost, and sales figures update automatically rather than requiring manual exports.
For operators managing compliance, Ezeepos supports daily reconciliation workflows and structured sales categorisation by channel. The cloud back-office technology gives you access to KPI dashboards from any device, so your numbers are never locked inside a single terminal. If you are ready to replace spreadsheets with a reporting system built for how UK hospitality actually works, explore Ezeepos and see what integrated reporting looks like in practice.
FAQ
What are the five KPIs every restaurant should track?
The five core KPIs are food cost percentage, labour cost percentage, prime cost, average check, and net margin. Tracking these consistently gives operators a clear picture of profitability without data overload.
How often should restaurant sales be reconciled?
Sales should be reconciled daily against payment processor reports and weekly against delivery platform payouts. Waiting until month-end makes it impossible to identify when errors or fraud first occurred.
What is the difference between a POS report and a BI platform?
A POS report shows transactional sales data from a single system. A BI platform normalises data from POS, inventory, labour, and accounting software into one comparable view, which is essential for multi-site operators.
Why do delivery platforms create tax compliance risks?
Delivery platforms sometimes remit incomplete tax amounts and apply inconsistent rounding. Documented mappings of platform tax treatments and cash rounding policies are the primary defence against HMRC audit exposure.
Do small restaurants need AI reporting tools?
Not necessarily. A single-site operator can manage effectively with a well-configured POS and a consistent weekly KPI review. AI tools add the most value when you have multiple revenue channels or locations generating data that manual processes cannot reconcile accurately.
Recent Comments