Examples of POS reports for hospitality venues
POS reports are structured data outputs generated by point-of-sale systems that summarise sales, inventory, staff performance, and customer activity across a hospitality venue. For bar owners, restaurant managers, and café operators, these reports are the difference between guessing and knowing. Whether you run a single site or a multi-location operation, the right examples of POS reports give you the financial clarity and operational control to make decisions that actually move the needle. Platforms like Ezeepos, Oracle NSPOS, and Shopify POS all generate these reports, though the depth and accessibility vary significantly by system type.
Examples of POS reports every hospitality venue needs
The most useful POS reports fall into five core categories: sales, inventory, employee, customer, and financial. Cloud and mobile POS systems provide real-time access to these reports, unlike legacy systems that require end-of-day batch processing. That distinction matters enormously when you need to make a staffing call at 7pm on a Friday.
Here is what each category covers:
- Sales reports: Revenue by time period, product, location, and payment method
- Inventory reports: Stock levels, reorder alerts, shrinkage, and valuation
- Employee reports: Labour costs, hours worked, sales per staff member
- Customer reports: New versus returning guests, average spend, visit frequency
- Financial reports: Tax summaries, gross profit, payment gateway breakdowns
Pro Tip: Review your summary dashboard daily for a quick health check, but schedule a weekly back-office session for thorough reconciliation. At-a-glance dashboards suit daily agility; detailed libraries of reports suit deeper analysis.
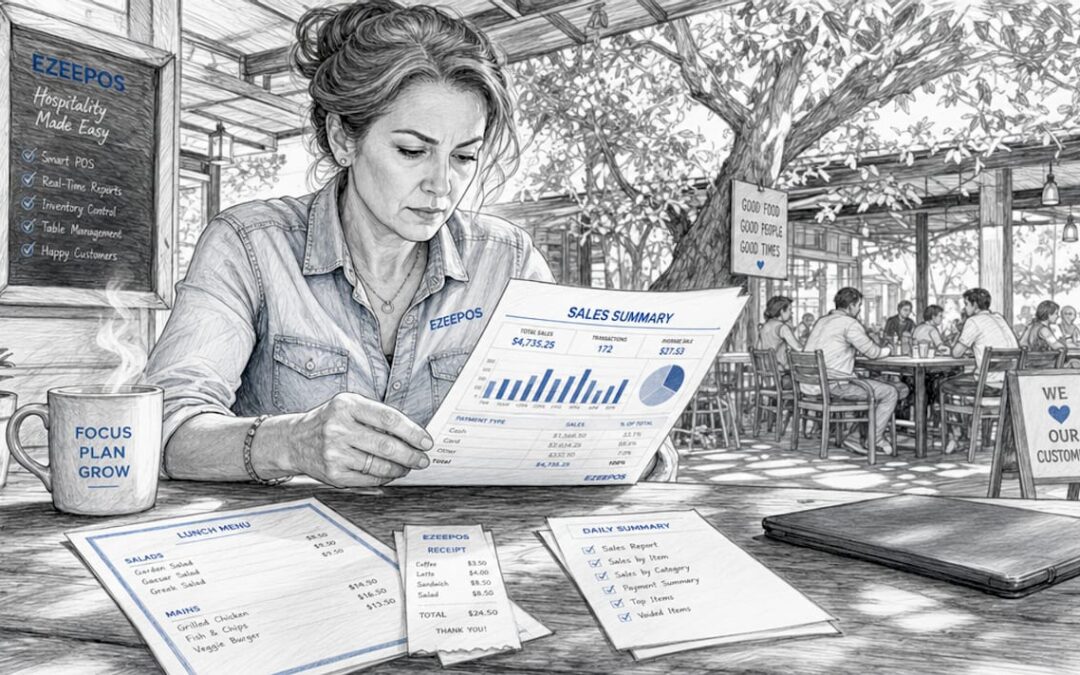
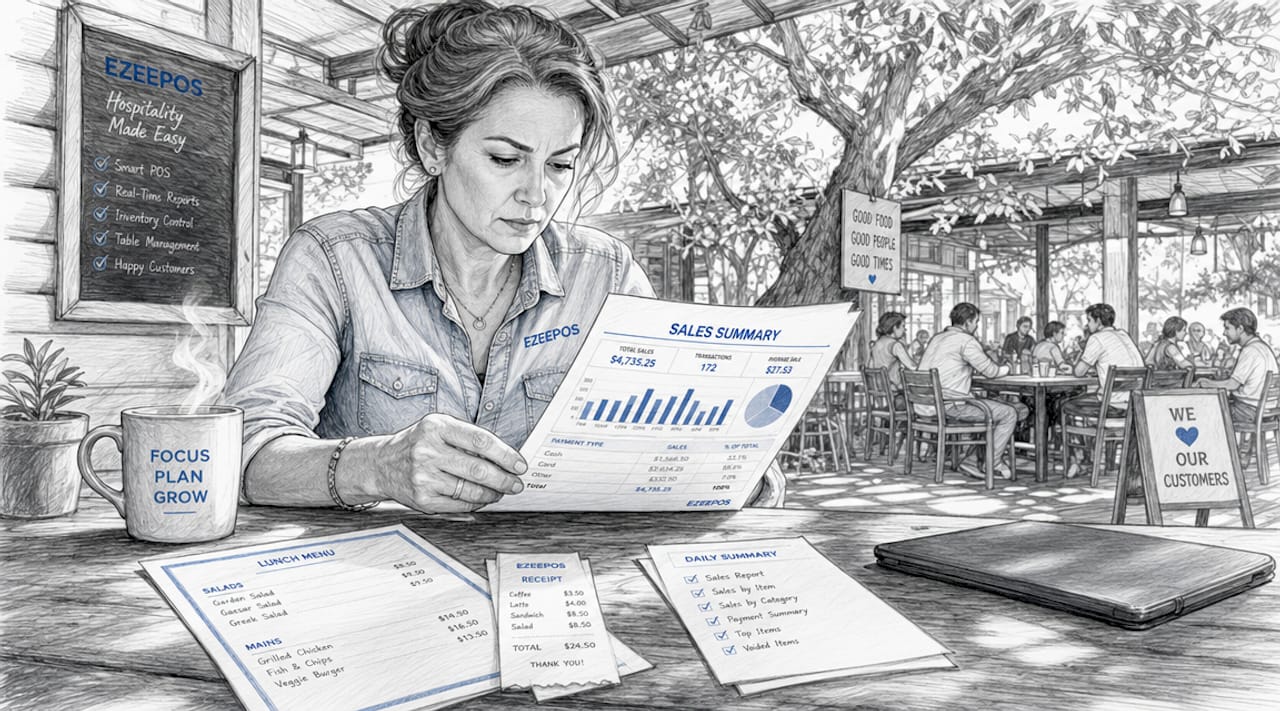
1. Sales summary report
The sales summary report is the most frequently used POS report format in hospitality. It provides a bird’s-eye view of total sales, transactions, deposits, and costs across a defined period. A busy pub might run this report every morning to confirm the previous evening’s takings match the till reconciliation.
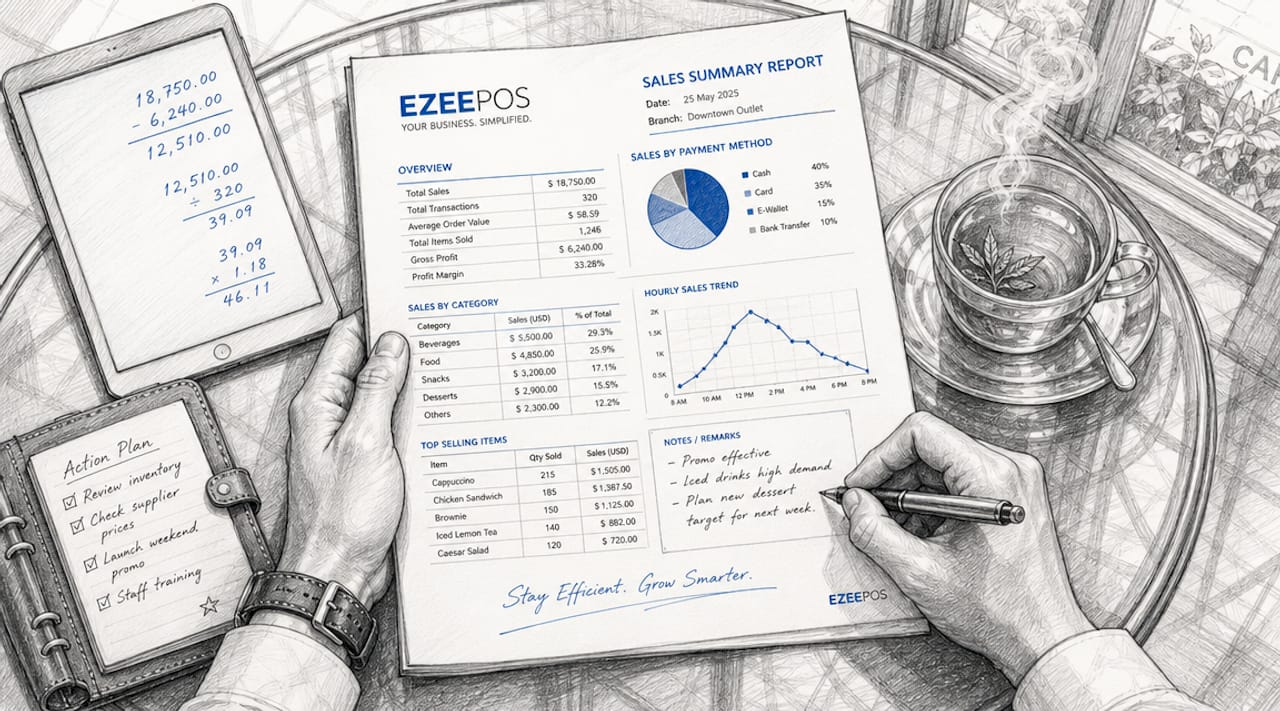
What makes this report particularly useful is the ability to slice the data. You can view totals by hour, by day, by week, or by payment method. A restaurant running a Saturday brunch service can compare this week’s revenue against the same Saturday last month without pulling a single spreadsheet. The report does the maths for you.
For multi-site operators, the sales summary becomes even more powerful. You can compare performance across locations in a single view, spotting which venue is underperforming before it becomes a cash flow problem.
2. Items sold report
The items sold report displays net sales over a chosen period, broken down by individual product, size, and quantity. Oracle NSPOS defines this as showing quantities sold and returned, with net sales calculated as sold minus returned items. For a café, this means knowing exactly how many flat whites, toasted sandwiches, and slices of cake moved on any given day.
This report is where menu decisions get made with confidence. If your smoked salmon bagel consistently outsells your BLT by a ratio of three to one, that is not a coincidence. It is a signal to stock accordingly, price strategically, and consider whether the BLT earns its place on the menu at all.
Returns data within this report also flags quality issues early. A spike in returned items on a specific dish warrants a conversation with the kitchen before it damages your reputation.
3. Sales by staff member report
Sales reports allow you to view performance by individual staff member, revealing who is upselling effectively and who may need additional training. This is one of the most underused POS reporting examples in hospitality, yet it delivers some of the sharpest operational insights available.
A bar manager reviewing this report might notice that one member of staff consistently processes 20% more transactions per shift than their colleagues. That person is either faster, more confident, or better at suggesting add-ons. Either way, you want to understand what they are doing and replicate it across the team.
The same report works in reverse. A staff member with low average transaction values during peak hours is a training opportunity, not a mystery. The data removes the guesswork from performance conversations and gives managers a factual basis for coaching.
4. Inventory on hand report
The inventory on hand report gives you a real-time snapshot of current stock levels across every product in your system. For hospitality venues where margins are tight and waste is expensive, this report is non-negotiable. It tells you what you have, what it is worth, and whether your stock levels align with expected demand.
Oracle NSPOS includes this as one of its core standard reports, alongside sales audit and time punch reports. The inventory on hand report is particularly valuable before a busy weekend or a private event, when running out of a key ingredient mid-service is not just inconvenient but costly.
Pair this report with your sales trend data and you can build a reliable ordering pattern that reduces both over-stocking and emergency purchases from expensive local suppliers.
5. Inventory reorder report
The reorder report triggers an alert when stock falls below a pre-set minimum threshold. Reorder reports notify venue managers when stock requires replenishment, with thresholds set per product. A wine bar might set its house red minimum at 24 bottles, receiving an automatic alert when stock drops to that level.
The practical benefit here extends beyond convenience. Venues that rely on manual stock checks miss reorder windows regularly, leading to gaps in service and frustrated customers. Automated reorder alerts remove human error from the equation entirely.
Pro Tip: Use your inventory management data to set reorder thresholds based on lead times from your suppliers, not just gut instinct. A supplier with a three-day delivery window needs a higher minimum threshold than one who delivers next morning.
The table below compares the two most common inventory POS report formats used in hospitality:
| Report type | Best used for | Key output |
|---|---|---|
| Inventory on hand | Daily stock visibility | Current quantities and valuations |
| Inventory reorder | Automated restocking | Alerts when stock hits minimum threshold |
6. Labour cost report
The labour cost report shows what percentage of your revenue is being spent on staff wages during any given period. Employee labour reports detail hours worked, overtime, sales per employee, and labour cost percentages to help balance service quality with cost control. For most hospitality venues, labour is the single largest controllable cost.
A restaurant targeting a 30% labour cost ratio can use this report to monitor whether each shift is hitting that benchmark. If a quiet Tuesday lunch is running at 55% labour cost because the rota was not adjusted, that is a direct hit to profitability that the report makes visible immediately.
The report also supports fair scheduling. When you can see exactly which shifts generate the most revenue per labour hour, you can build rotas that match staffing levels to genuine demand rather than habit.
7. Time entry and attendance report
Time entry reports record clock-in and clock-out times for every staff member, including job titles and pay scales. This feeds directly into payroll accuracy and overtime management. A venue with 15 staff members across multiple shifts cannot rely on paper timesheets without introducing errors.
For hospitality managers overseeing staff management across busy services, this report also reveals patterns. If a staff member is consistently clocking out 30 minutes late, that is either a scheduling problem or a workload problem. Both are worth addressing before they become a retention problem.
8. Financial summary report
The financial summary report consolidates sales, payments, liabilities, gross profit, and tax breakdowns into a single view. Financial POS reports summarise payments by method and gateway, total sales breakdowns, and tax figures crucial for hospitality cash flow management. This is the report your accountant wants to see and the one that drives VAT submissions.
Payment method breakdowns within this report are particularly revealing. If 40% of your transactions are cash but your cash-up figures are consistently short, the report creates an audit trail that manual processes simply cannot match. It also shows whether contactless, card, and mobile payments are shifting in proportion over time, which informs decisions about payment hardware investment.
9. Customer behaviour report
Customer reports track new versus returning guests, average spend per visit, and purchase patterns over time. For a café or restaurant building a loyalty programme, this data is the foundation. You cannot reward your best customers if you do not know who they are.
A venue that identifies a cohort of customers spending above average on weekday lunches has a clear upsell opportunity. A targeted promotion on a premium lunch option, communicated via email or app notification, is far more likely to convert than a blanket discount. The customer behaviour report makes that precision possible.
Key takeaways
Effective POS reporting gives hospitality venues the financial and operational data needed to make confident decisions on staffing, stock, and sales strategy.
| Point | Details |
|---|---|
| Start with sales summaries | Run daily sales summary reports to confirm takings and spot revenue trends early. |
| Use items sold data for menus | Items sold reports reveal which dishes earn their place and which should be cut. |
| Automate stock reordering | Set minimum thresholds in your reorder report to remove manual stock-check errors. |
| Monitor labour cost ratios | Labour cost reports show whether each shift is hitting your target cost percentage. |
| Review financial reports weekly | Financial summaries support VAT accuracy and reveal payment method trends over time. |
Why most venues only scratch the surface of their POS data
I have worked with hospitality operators across the UK for years, and the pattern I see most often is this: managers run the sales summary every morning and ignore everything else. The inventory report sits untouched until there is a crisis. The labour cost report gets opened once a month, if that. The data is there. The habit of using it is not.
The venues that genuinely profit from their POS reporting are not necessarily the ones with the most sophisticated systems. They are the ones with a consistent weekly rhythm. Monday morning: review the sales trend from the weekend. Wednesday: check inventory levels against the weekend forecast. Friday: review labour costs against revenue for the week. That discipline, applied consistently, compounds over time into real margin improvement.
One thing I would push back on is the idea that you need to review every report type to get value. For a small café with one site and five staff, the items sold report and the labour cost report will deliver 80% of the insight you need. Start there. Add complexity as your operation grows, not before.
The other mistake I see regularly is treating POS reports as a finance function rather than an operational one. Your floor manager should know how to read a sales by staff report. Your head chef should be looking at the items sold data weekly. When the people closest to the operation understand the numbers, the numbers actually change.
— John
How Ezeepos makes POS reporting simple for UK venues
Ezeepos is built specifically for UK hospitality venues, from independent cafés to multi-site bar groups. The platform generates all the report types covered in this article through a cloud-based back office, accessible from any device without the need for on-site servers. Sales summaries, inventory snapshots, labour cost breakdowns, and financial reports are all available in real time, with no tiered pricing that locks key features behind a premium plan. Every venue gets the full reporting suite from day one. If you are ready to move from guesswork to data-driven decisions, explore the Ezeepos POS platform and see how straightforward hospitality reporting can be.
FAQ
What are the main types of POS reports?
The main types of POS reports are sales, inventory, employee, customer, and financial reports. Each category covers a different aspect of venue operations, from revenue tracking to labour cost management.
How do I use POS reports to reduce stock waste?
Use the inventory on hand report for daily stock visibility and set minimum thresholds in your reorder report to trigger automatic restocking alerts. This removes manual errors and prevents both over-ordering and running out of key items.
What does a labour cost POS report show?
A labour cost report shows hours worked, overtime, sales per employee, and the percentage of revenue spent on staff wages. Hospitality venues typically target a labour cost ratio between 25% and 35% of revenue.
How often should hospitality venues review their POS reports?
Sales summary reports benefit from daily review, while inventory and labour cost reports are best reviewed weekly. Financial summary reports should be checked at least monthly to support VAT submissions and cash flow planning.
Can POS reports help with staff performance management?
Sales by staff member reports show individual transaction volumes and average spend per customer, giving managers a factual basis for performance conversations and targeted training decisions.
Recent Comments