
Hospitality menu engineering explained for operators

Menu engineering is a systematic, data-driven process that combines sales volume, food costs, and contribution margin analysis to optimise every item on your menu for both popularity and profitability. The framework at its core is a four-quadrant matrix classifying dishes as Stars, Plowhorses, Puzzles, or Dogs, giving operators a clear, evidence-based method to decide what to feature, adjust, reposition, or remove. A well-executed programme can lift profits by 12% to 18% within roughly 90 days. For any hospitality professional serious about margin control, this is the most direct lever available.
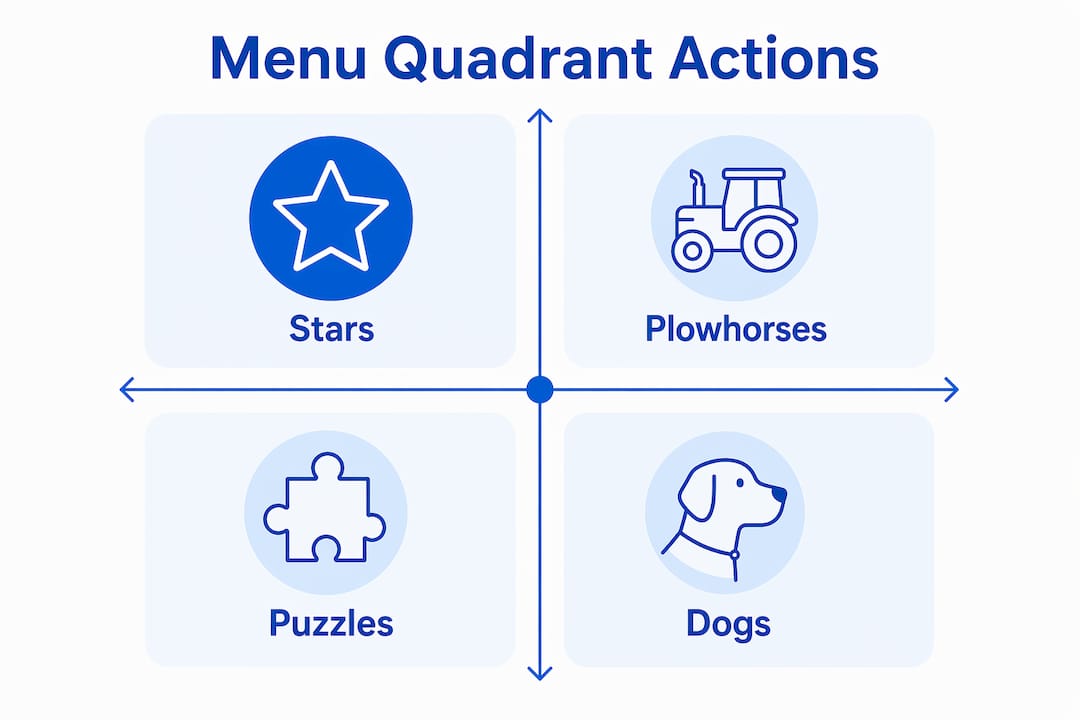
What is the menu engineering matrix and how does it work?
The menu engineering matrix plots every dish on two axes: popularity (how often it sells) and profitability (how much contribution margin it generates). Contribution margin per dish is calculated simply as selling price minus food cost, and it is the true measure of what each item actually contributes to covering overheads and generating profit. Food cost percentage alone tells you nothing useful about absolute profit. A dish priced at £8 with a 30% food cost contributes £5.60. A dish priced at £22 with a 40% food cost contributes £13.20. The second dish is the better performer despite the higher cost ratio.
Popularity is measured by menu mix percentage, which is each item’s share of total covers sold within a defined period. The standard data window is 30 to 90 days of POS sales, long enough to smooth out daily variance but short enough to remain current. Once you have both metrics for every item, you set thresholds for “high” and “low” in each dimension, typically the average contribution margin and the average menu mix percentage, and plot each dish into one of four quadrants.
The table below illustrates how four example dishes from a typical casual dining menu would be classified:
| Dish | Selling price | Food cost | Contribution margin | Menu mix % | Quadrant |
|---|---|---|---|---|---|
| Grilled salmon | £18.50 | £6.20 | £12.30 | 22% | Star |
| Beef burger | £14.00 | £5.80 | £8.20 | 28% | Plowhorse |
| Truffle risotto | £17.00 | £5.10 | £11.90 | 7% | Puzzle |
| Vegetable tart | £12.50 | £5.40 | £7.10 | 5% | Dog |
Stars deliver high margin and high volume. Plowhorses sell well but return a lower margin. Puzzles are profitable but underordered. Dogs underperform on both counts. Each quadrant demands a different operational response.
What actions should you take for each quadrant?
Knowing which quadrant a dish occupies is only useful if you act on it. The strategies below are specific to each category and grounded in what effective menu management actually requires in practice.
Stars are your highest-priority items. Protect their recipes rigorously, because any change to ingredients or portion size risks eroding the margin or the guest experience that drives their popularity. Place them in prime menu real estate and never discount them without a clear strategic reason.
Plowhorses are the trickiest category. Guests love them, but they are not pulling their financial weight. Your options are:
- Raise the price modestly, typically by £1.00 to £1.50, to test price elasticity without triggering resistance
- Reduce portion size or substitute a lower-cost ingredient that does not compromise perceived quality
- Bundle the item with a higher-margin side to lift the average transaction value
- Reposition it away from the most prominent menu spots so it does not cannibalise sales of Stars
Puzzles have the profit but lack the audience. The fix is almost always about visibility and language rather than the dish itself. Rename the item to something more evocative, rewrite the description using sensory and provenance-based language, and move it to a hot spot on the page. Descriptive menu language increases orders by approximately 27%, which is a significant uplift for an item that already delivers strong margin.
Dogs require an honest conversation. Some have sentimental value or serve a dietary niche that matters to your brand. If a Dog cannot be reworked to improve either its margin or its popularity within one review cycle, remove it. A shorter menu is almost always easier to execute, cheaper to stock, and faster to serve.
Pro Tip: Place your top two Stars and your most promising Puzzle as the first and last items in each menu section. Research shows that prime menu positions can increase an item’s order rate by three to seven times compared with mid-section placement.
How to calculate contribution margin accurately
Contribution margin accuracy depends entirely on the quality of your recipe costing. Every ingredient in every dish needs a current, supplier-verified cost per unit, scaled precisely to the portion served. This is where most operators fall short. They use approximate costs from memory or last quarter’s invoices, then wonder why their matrix does not reflect reality.
The calculation itself is straightforward: selling price minus total plate cost equals contribution margin. The discipline lies in keeping plate costs current. Ingredient prices shift with supplier contracts, seasonality, and commodity markets. A dish costed in January may have a materially different margin by April if key ingredients have moved. Operators should update recipe costs quarterly at minimum, and immediately after any significant supplier price change.
The table below shows why relying on food cost percentage alone misleads operators:
| Dish | Selling price | Food cost | Food cost % | Contribution margin |
|---|---|---|---|---|
| Lobster bisque | £12.00 | £5.40 | 45% | £6.60 |
| Side salad | £5.50 | £0.83 | 15% | £4.67 |
The lobster bisque looks expensive by food cost percentage, but it contributes £1.93 more per cover than the side salad. A menu engineer keeps the bisque. A cost-percentage-focused operator might cut it.
Pro Tip: Run your matrix separately for lunch and dinner. Ordering behaviour varies by daypart, and a dish that is a Dog at lunch may be a Star at dinner. Combining the data obscures this and leads to poor decisions.
How does menu layout influence what guests order?
Menu design and layout directly shape which items guests notice, consider, and ultimately order. This is not a soft, aesthetic concern. It is a financial one. The physical or digital structure of your menu is the final delivery mechanism for all the analysis you have done.
Guests scan menus in predictable patterns. On a single-page menu, the eye typically travels to the top right first, then moves left and down. On a multi-page or folded menu, the first item in each section and the last item before a visual break receive disproportionate attention. These are your hot spots, and they should be occupied by Stars and your most promising Puzzles.
Section ordering matters too. Menus that follow the natural meal sequence (starters, mains, desserts, drinks) reduce cognitive friction and keep guests moving through the ordering process. Disrupting this flow, by placing desserts before mains or drinks at the back, forces guests to work harder and often results in lower spend per cover.
Typography and whitespace are practical tools, not decorative choices. A menu with too many fonts, dense text blocks, or inconsistent spacing is harder to read and reduces the time guests spend on any individual item. Limit yourself to two typefaces, use clear hierarchy between section headings and item names, and give each dish enough space to breathe.
Pricing presentation also shapes behaviour in measurable ways. Removing the £ symbol reduces price salience and encourages guests to focus on the dish rather than the cost. Charm pricing (£9.95 rather than £10.00) still works in casual and fast-casual settings. Anchor pricing, placing a high-priced item at the top of a section to make the items below it feel reasonable, is one of the most effective and underused tools in hospitality menu design.
Photos and icons should be used selectively. One or two images per section, reserved for your highest-margin Stars or a Puzzle you are actively promoting, draw the eye without overwhelming the page. A menu covered in photographs signals low quality to many guests and dilutes the impact of each image.
Key takeaways
Menu engineering works because it combines financial data with guest psychology to turn your menu into a structured profit tool rather than a list of dishes.
| Point | Details |
|---|---|
| Use contribution margin, not food cost % | Contribution margin reveals true profit per dish; food cost percentage alone misleads classification. |
| Run the matrix every quarter | Ingredient costs shift; outdated data mislabels Stars as Dogs and vice versa. |
| Act differently for each quadrant | Stars need protection, Plowhorses need margin work, Puzzles need visibility, Dogs need removal or rework. |
| Menu layout is a financial decision | Hot spot placement can increase an item’s order rate by three to seven times. |
| Separate analysis by daypart | Lunch and dinner ordering patterns differ enough to change a dish’s quadrant classification entirely. |
Why most operators treat menu engineering as a one-off project (and why that is a mistake)
I have worked with enough hospitality operators to know that the most common failure mode in menu engineering is not the analysis itself. It is the follow-through. Teams invest time in building the matrix, make a round of changes, and then leave the menu untouched for 18 months while ingredient costs drift, seasonal dishes become permanent fixtures, and a former Star quietly becomes a Plowhorse.
The discipline that separates genuinely profitable menus from average ones is the commitment to treating this as an ongoing cycle rather than a project. That means scheduled quarterly reviews, not reviews triggered by a bad month. It means keeping your POS analytics connected to your recipe costs so that the data you need is always current. And it means training your front-of-house team to understand which items you want them to recommend, because the best menu engineering in the world is undermined by a server who defaults to describing the cheapest dish on the table.
There is also a tendency to over-engineer the psychology side and under-invest in the financial side. Operators spend hours debating font choices and photograph placement while their recipe costs are six months out of date. Get the numbers right first. The layout decisions are only as good as the data behind them. When both are working together, the results are not marginal. A well-executed programme can lift profits by up to 23%, and that figure comes from operators who treated the process seriously, not as a one-afternoon exercise.
— John
How Ezeepos helps you put menu engineering into practice
Menu engineering produces results only when your sales data is accurate, current, and accessible. Ezeepos gives hospitality venues the POS infrastructure to make that happen without manual spreadsheet work or guesswork.
The Ezeepos platform captures item-level sales data in real time, so your menu mix percentages are always current. Combined with inventory tracking features, you can align plate costs directly with sales volumes and generate the contribution margin data your matrix depends on. Whether you run a café, a bar, or a multi-site restaurant group, the system is built to support the kind of ongoing, data-driven menu review that actually moves the needle. Explore the Ezeepos POS solution to see how it fits your operation.
FAQ
What is menu engineering in hospitality?
Menu engineering is the practice of classifying every menu item by its contribution margin and sales popularity to make informed decisions about pricing, placement, and dish composition. The goal is to steer guests towards items that are both popular and profitable.
How often should you update your menu engineering matrix?
Operators should review the matrix quarterly and immediately after any significant shift in ingredient costs or supplier pricing. Outdated cost data leads to misclassification and poor decisions.
What is the difference between a Star and a Plowhorse?
A Star has both high popularity and high contribution margin. A Plowhorse sells well but returns a lower margin per cover, meaning it drives volume without proportionate profit.
Can menu engineering work for small cafés and quick-service venues?
Menu engineering applies to any venue with a menu and sales data, regardless of size. Smaller menus are often easier to analyse and yield faster results because there are fewer items to classify and adjust.
Why is food cost percentage not enough for menu analysis?
Food cost percentage does not reflect the absolute profit a dish generates. A high-cost-percentage dish can contribute more pounds per cover than a low-cost-percentage dish, making it the better performer by any meaningful financial measure.
Recent Comments